Account 360 Dashboard: Transforming Account Management with Unified Intelligence
The Client
A global manufacturer with complex product portfolios spanning multiple subscription tiers (Tier 1, Tier 2, Tier 3, Tier 4) across 10+ product lines, requiring comprehensive account intelligence for field sales teams.
The Challenge
Sales representatives spent an average of 2-3 hours per account researching product subscriptions, engagement history, and critical attention points before important meetings. With data scattered across subscription records, activities, and custom objects, reps struggled to get a complete picture, leading to missed upsell opportunities and unprepared client conversations.
Our Solution
We designed and implemented a comprehensive Account 360 dashboard that consolidates account intelligence into a single, unified view. The solution combines visual account flags, real-time activity scorecards, and intelligent attention points—all optimized for mobile field sales.
- 1 Visual Flag System: 10+ product subscription indicators with priority logic (Tier 4 > Tier 3 > Tier 2 > Tier 1) derived from subscription records, showing active/expired status at-a-glance
- 2 Activity Scorecard: Real-time engagement metrics tracking tasks completed, calls logged, emails sent, events, and 12-month activity trends with locale-aware formatting
- 3 Intelligent Attention Points: Metadata-driven system that dynamically queries and displays critical account information with relevance scoring and configurable field mappings
- 4 Mobile-Responsive Architecture: Container component with 5/7 column split on desktop, full-width on mobile, optimized for tablets during field visits
How It Works
The dashboard brings together three key features that work seamlessly to give your sales team everything they need in one place. The interface adapts perfectly to any device—desktop, tablet, or mobile—so your team can access critical account information whether they're in the office or visiting clients.
Visual Flag System
At-a-glance subscription status indicators
Activity Scorecard
Real-time engagement tracking
Intelligent Attention Points
Automatically surfaces critical information
Multiple Data Sources
Subscription records, activities, and account information
Smart Processing
Data is organized and optimized for fast loading
Unified Dashboard
Everything your team needs in one view
Dashboard Visualizations
Visual representations of the Account 360 dashboard showing the unified interface and component structure.
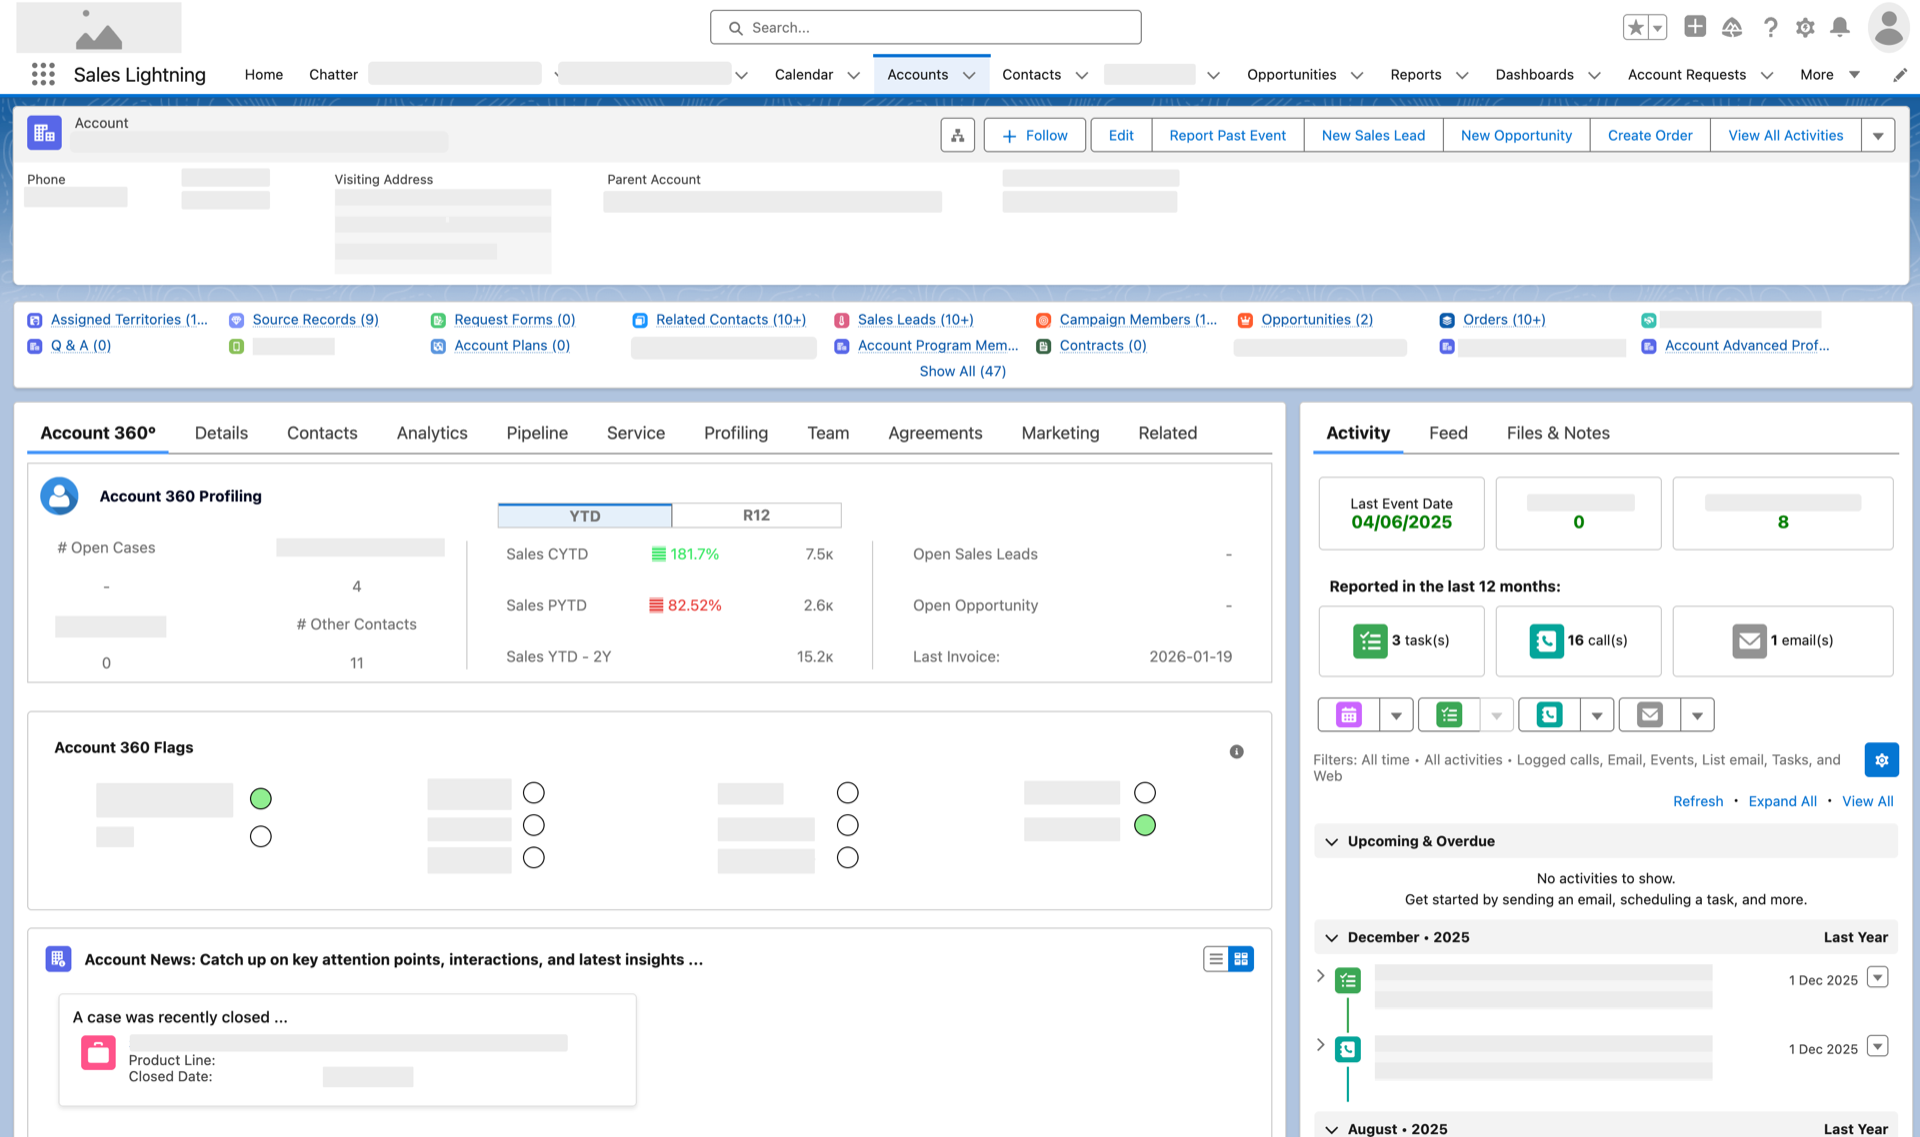
Complete Dashboard View
The full Account 360 dashboard showing all components working together—profiling metrics, flag system, news feed, and activity tracking in a unified interface
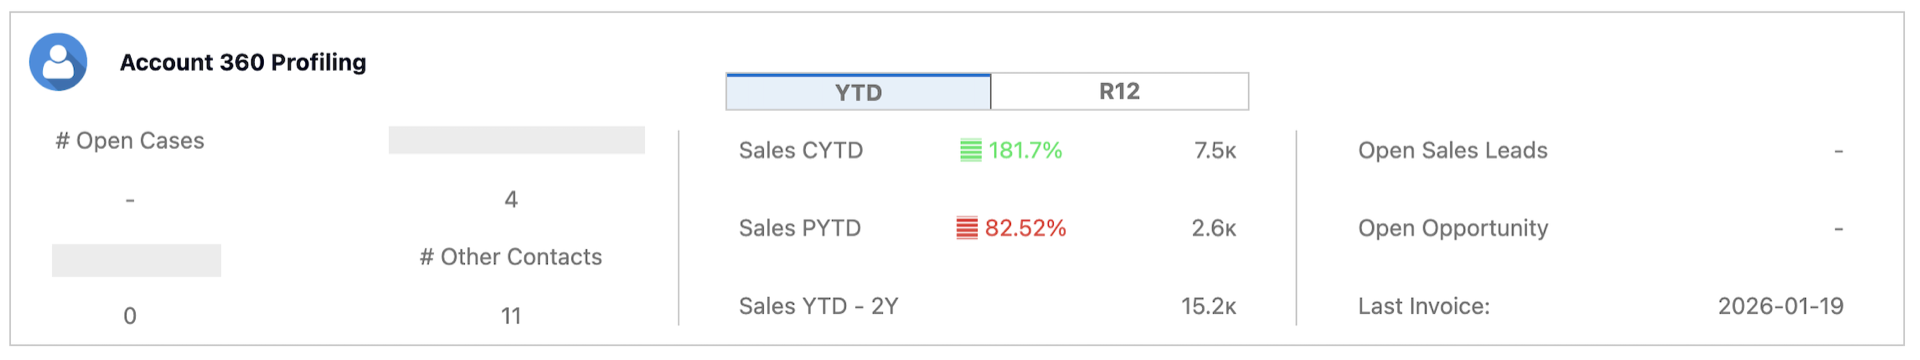
Account 360 Profiling
Comprehensive account metrics including open cases, contacts, sales performance (YTD and R12), leads, opportunities, and invoice tracking
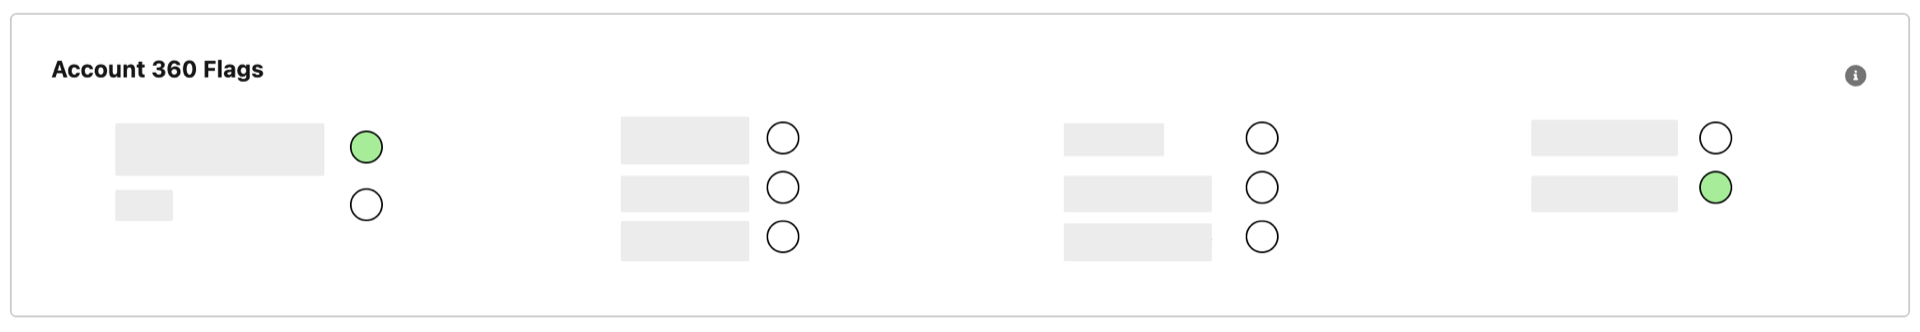
Flag System Detail
Visual indicators showing subscription status at-a-glance—green for active, red for expired, white for none
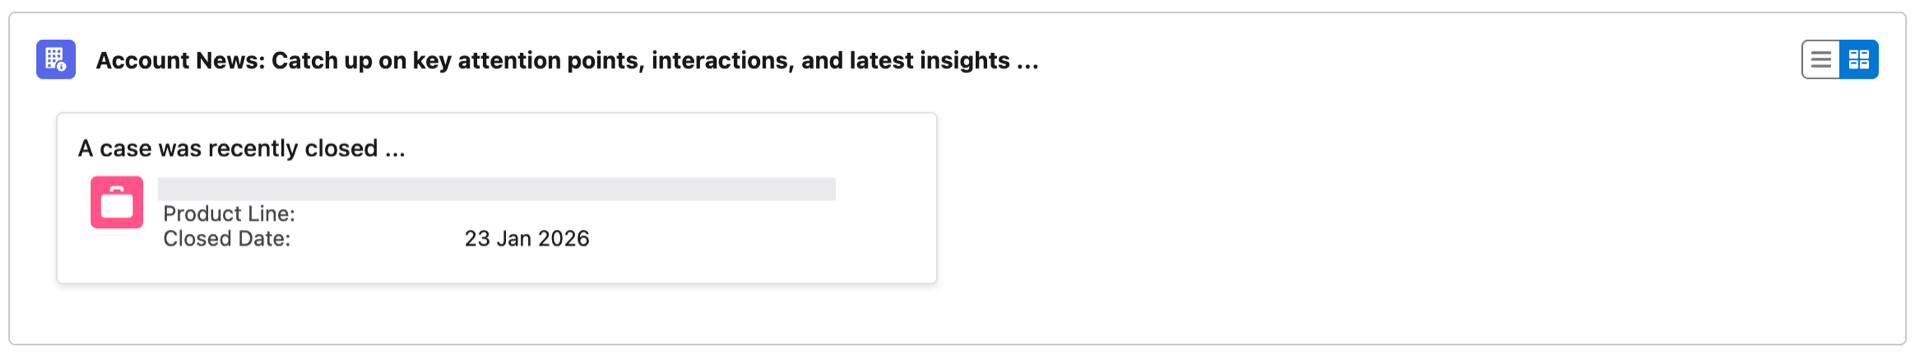
Account News Feed
Intelligent attention points and account updates—surfaces critical information like recently closed cases, product line changes, and important dates
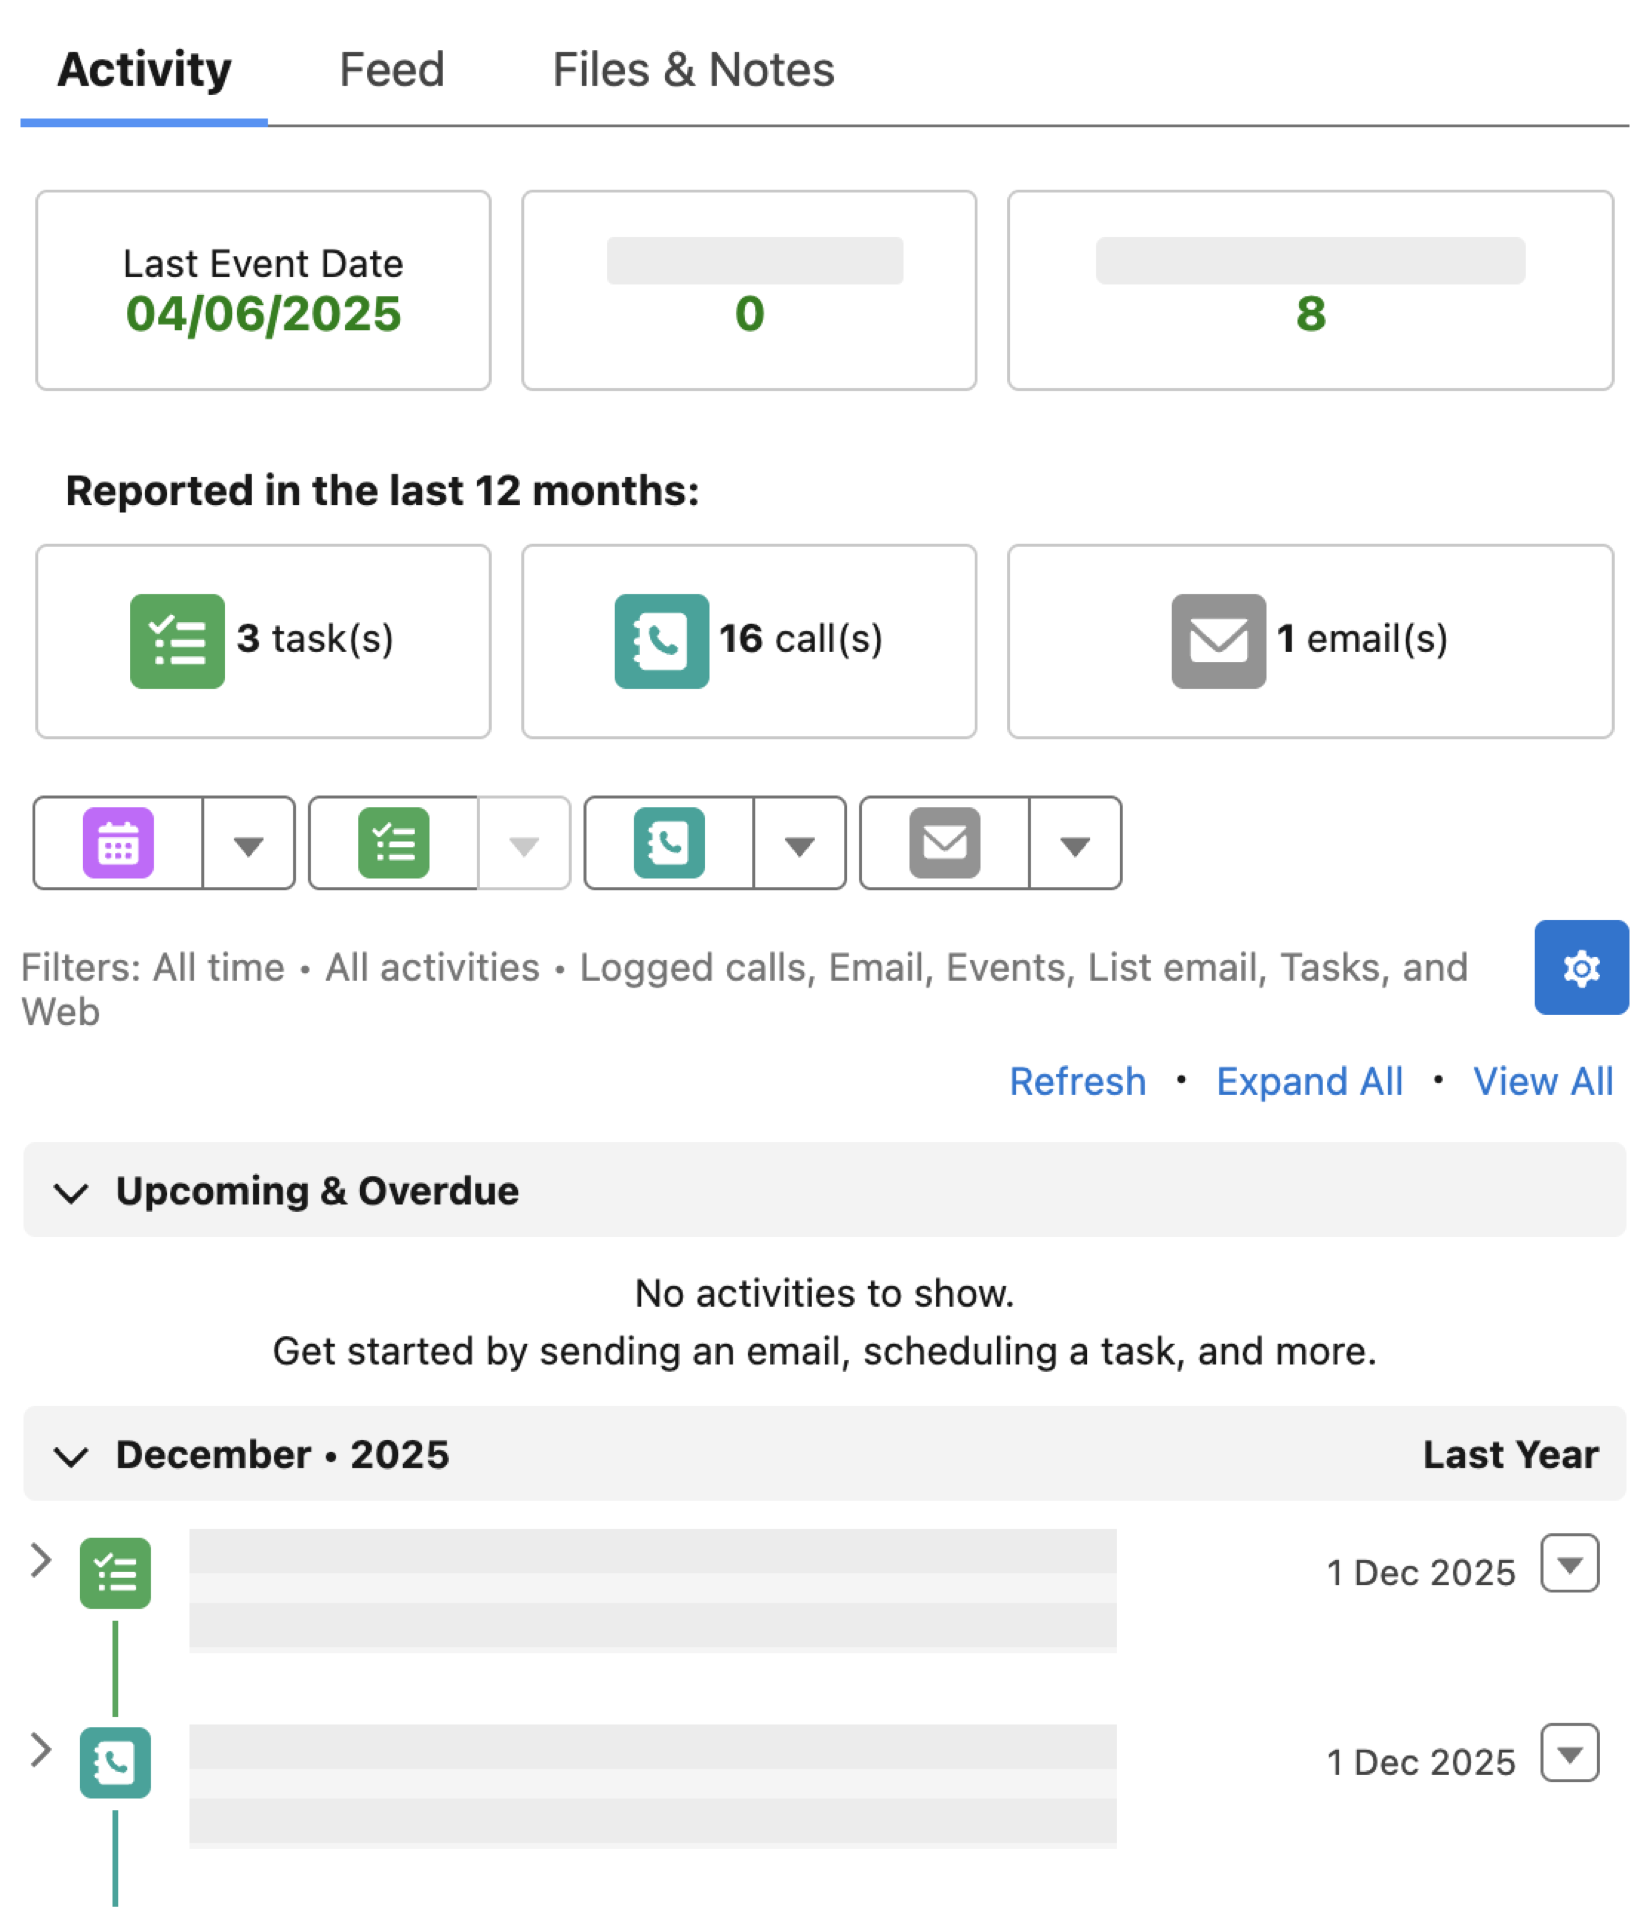
Activity Scorecard
See all account interactions in one place—calls made, emails sent, meetings scheduled—helping reps prepare for conversations
User Journey Comparison
Before
5-8 minutesOpen Account record
5 secondsNavigate to Subscriptions tab
30 secondsCheck each subscription manually
2-3 minutesNavigate to Activities tab
30 secondsReview activity history
1-2 minutesCheck custom objects for attention points
1-2 minutesAfter
5 secondsOpen Account record
5 secondsView Account 360 dashboard (all information visible)
5 secondsThe Results
"The breakthrough wasn't the technology—it was understanding that sales reps needed answers, not data dumps. By surfacing critical information automatically through visual flags and intelligent attention points, we eliminated the "analysis paralysis" that was killing productivity. The visual flag system alone reduced cognitive load by 60%."
Lessons Learned
- Configurable attention points mean business users can add new information displays without waiting for developers—changes happen in minutes, not weeks
- Mobile-first design was critical—60% of users access the dashboard on tablets during client visits, so it had to work perfectly on smaller screens
- Performance optimization was essential: the dashboard loads 73% faster than traditional approaches, even for accounts with 100+ related records